Covid-19 FAQs
The coronavirus pandemic has led to many different statistics being presented to us from the media, official sources and perhaps more unofficial sources. But what do they all mean, how should we interpret them, and in what ways do they affect us personally?
Members of our Covid-19 Task Force have been working hard to answer the common questions around the numbers that are commonly used to discuss the pandemic. Click on each question individually to be taken to the relevant answer.
- What is R, and how is it determined?
- How can I find my personalised risk?
- What can we tell from international comparisons?
- How many people have died because of Covid-19?
- Where can I find raw data on Covid-19?
- How is data used to decide which tier I am in?
- What does ‘90% effective’ vaccine mean?
- Are people dying ‘with’ Covid or ‘from’ Covid?
- How many people who have died due to Covid-19 would have died soon anyway?
- How will the risks in future compare with the risks in the peak of the epidemic?

1. What is R, and how is it determined?
The reproduction number is the average number of direct infections from one case. This is over the whole time while people are infectious.
If the reproduction number is 2, we expect 100 infected people to infect 200 more people. If the reproduction number is 0.5, the average group of 100 infected people infects 50 more.
The reproduction number can change over time. If people reduce contacts, the virus has fewer transmissions.
The basic reproduction number (R₀) is for when the population has no immunity. This is not a biological constant. The same virus may spread in different populations at different paces. By itself, this number does not determine how fast a virus spreads. Initial ‘seed’ cases and infectious periods are important.
Suppose people can recover, conferring immunity. Over time, more infected people will recover, die, or get vaccinated. The effective reproduction number is for the remaining susceptible population.
Reproduction numbers are averages.
One person could pass on the virus to 100 people, and 99 others do not pass it on. In that population, the average new infections is 1. If every infected person infects one more, that would be the same reproduction number. The implications for health policy differ.
How is the reproduction number estimated?
Researchers estimate this number, through mathematical models.
Model inputs could include:
- Data on confirmed infections, hospital admissions, critical care, and/or deaths.
- Social contact surveys, with self-reported data on contacts.
- Household infection surveys, which can estimate current prevalence of infections.
The MRC Biostatistics Unit (Cambridge) uses transmission models. Researchers stratify these models by age and region. Their work takes death figures, mortality risks, and time from infection to death. Researchers estimate new infections over time and reproduction numbers. Different groups of researchers use a variety of models to estimate R, each with their own estimated uncertainty, and then a pooled judgement is reached by SPI-M-O (Scientific Pandemic Influenza Group on Modelling, Operational sub-group), which feeds its conclusions into Sage.
Reproduction number estimates are uncertain, and can be hard to interpret.
There are several sources of uncertainty:
- Accuracy of input data.
- Model choice, as different approaches give different estimates.
- How sensitive underlying assumptions in each model are.
The reproduction number refers to the average infected person. That average person changes. At lower infection levels, reproduction number estimates are more volatile.
A national reproduction number may be less useful than those of groups and areas. On the other hand, estimates relating to small groups will be more uncertain.
We should look at the reproduction number alongside other key statistics. There is a plausible range around reproduction number estimates, and these are generally provided. For example, the Gov.uk website provides a good discussion of the current estimates of R in different regions of the country, with uncertainty intervals.
Back to top

2. How can I find my personalised risk?
In this pandemic, there are several risks to consider, including:
- The risk of getting a SARS-CoV-2 infection;
- The risk of hospitalisation or dying after catching Covid-19.
- The risk of infecting others;
Analysis by the Office for National Statistics suggests age and sex are important influences on the risk of both being infected and dying from Covid-19: older people are far more likely to die with the disease. In each age group, estimated mortality rates are higher for men than women. That analysis covers England and Wales, using death certificates registered up to 4th July 2020.
The QCovid risk calculator features a more personalised model, although it is says it is not intended for clinical use. After entering your age, sex, ethnicity, BMI, postcode and any clinical conditions, QCovid gives an abolute risk of being infected and then being hospitalised or dying from Covid-19 in the first wave, as well as a relative risk compared with similar person with no clinical conditions. It is based on the analysis of over 10 million GP records, but could underestimate the risk for individuals who were shielding in the first wave.
The University of Exeter produced a tool for calculating an individual risk score for catching and then hospitalisation with Covid-19 and dying due to the disease. The British Medical Association adopted (PDF) this tool for healthcare workers. This simplified score uses age, sex, ethnicity, and health conditions to produce a score that measures a worker’s risk relative to a healthy younger white female.
Another calculator designed for occupational health is the ‘Covid Age’ site hosted by the Association for Local Authority Medical Advisors, which is based on analysis of 17 million patients in the Open Safely study. This estimates the age of a healthy white man with a similar risk as the person providing the information, and uses that ‘Covid age’ to estimate vulnerability - that is the chance of dying from Covid-19 if infected. This is one of the only calculators that provides this vital information.
Calculators could miss major factors to your personal risk. The calculations often rely on statistical associations. There may be confounding factors. Such tools provide simplified estimates based on historical outcomes for a group of people who match you in the details entered: your personal risk could be somewhat higher or lower.
The results do not override government guidance or advice from doctors. Scientific understanding of personal risks develops with further research.
As this is a pandemic: this is not only about personal risk, but the risk of spreading infections to others, some of whom are particularly vulnerable.
Back to top

3. What can we tell from international comparisons?
International comparisons are challenging.
First, there is no standard definition of a ‘Covid-19 death’. Before mid-August, there were different definitions in the United Kingdom used for the daily counts:
After a review by Public Health England, the changed measure uses the 28-day cut-off for the UK for the daily reports on the Coronavirus dashboard, although the more reliable, those less timely, weekly death registrations from the Office for National Statistics are also now provided.
Other countries have different criteria. RIVM in the Netherlands counts 'overleden Covid-19 patiënten' (deceased Covid-19 patients). This measure counts deaths in hospital with a positive test result. Sciensano in Belgium includes deaths where doctors suspect the deceased has Covid-19.
Countries can change definitions too. Interpretations are also difficult. Countries have different testing regimes. Processed tests affect the number of confirmed deaths. Tests can differ: false negative results reduce lab-confirmed deaths.
Travel influences seeds and outbreaks. How many people live close together affects how this virus spreads. Demography, cultures, and health policies differ.
Despite these challenges, countries can learn from each other during this pandemic.
We should avoid precise league tables, and think more in broad tiers of countries.
Our World in Data highlights three ‘success stories’: Vietnam, Germany, and South Korea. The broad conclusion is effective responses need strong action in four areas. These actions cover: prevention, detection, containment, and treatment.
Back to top

4. How many people have died because of Covid-19?
Up to 27 January 2021, there had been over 103,000 deaths in the UK with Covid-19 on the death certificate. Most of these have Covid-19 as the immediate cause of death.
There are three main ways to count Covid-19 deaths:
- Confirmed deaths: deaths with a positive test result for SARS-CoV-2
- Death certificates: deaths with a medical certificate which mentions Covid-19. Certificates mention a disease either as a cause or contributory factor (see Are people dying ‘with’ Covid or ‘from’ Covid?)
- Excess deaths: comparing the number of deaths from all causes, to a baseline.
Each measure has different strengths and limitations.
Confirmed deaths
A confirmed death means a death with a positive test result for SARS-CoV-2. There are differences in precise definitions between nations. The main strength of this measure is timeliness. As it depends on positive tests, this count reflects testing availability and accuracy. This count excludes deaths with Covid-19 that had no test or only a false negative result.
Death certificates
Statistical offices publish death registration figures. These registrations have clinical judgements about how people died. A Medical Certificate of Cause of Death has two parts:
- The sequence of diseases or conditions that led to the death;
- Other significant factors, which contributed to the death.
Clinicians must certify causes of death 'to the best of their knowledge and belief'. (PDF)
This count is of certificates that mention Covid-19. That means the disease was a cause or contributing factor to the death. Doctors may suspect the deceased has Covid-19 without a positive test result.
The main strength is the inclusion of suspected deaths. Statistical offices can provide analysis on the underlying causes of death. One limitation is timeliness: it takes time to register and process these certificates. Clinical suspicions can be wrong.
Excess deaths
Excess deaths is the difference between deaths from all causes and a baseline value. For the Office for National Statistics, that baseline is the average of the past five years.
This measure has many strengths:
- Consistency: we can calculate excess deaths in the same way, across nations.
- Reporting: this measure is not influenced by reporting practices. Confirmed deaths rely on tests done. Doctors may be hesitant to mention Covid-19 without lab-confirmation.
- Completeness: pandemics pressurise healthcare services. There may be deaths resulting from disruption to healthcare, or other negative effects.
Excess deaths are not direct deaths from Covid-19. It is a statistical measure, dependent on choice of the baseline.
Back to top

5. Where can I find raw data on Covid-19?
There are several data sources for the public to look at for UK Covid-19 statistics.
There are daily Covid-19 dashboards produced by the UK’s four public health agencies:
There are also weekly reports on Covid-19:
- Public Health England: national flu and Covid-19 surveillance reports: these contain detailed, downloadable data on a wide range of indicators, including Covid test results by age-group and region, as well as outbreaks of respiratory diseases, excess deaths and so on. The excess death estimates are more up-to-date than ONS figures, and are based on more sophisticated modelling, but they warn that recent excess death estimates are subject to revision and need to be treated with caution.
- Public Health Scotland: Covid-19 statistical reports
- Public Health Agency (Northern Ireland): Coronavirus bulletin: these contain high-level statistics on COVID-19 activity. The reports provides analysis of demographic characteristics (age, sex, geography, and deprivation) of people affected by the virus
The three statistics offices produce death registration statistics:
Clinical statistics are available for the National Health Service, including Hospital Activity, Daily Deaths and Vaccinations. These feed into the main UK Government Covid-19 Dashboard:
The Office for National Statistics runs a UK-wide coronavirus infection survey, and provide an interactive dashboard bringing together a wide range of Covid statistics, including mental health and surveys of behaviour.
For international comparisons, Our World in Data collates international statistics for Covid-19, including on vaccinations, and allows flexible comparisons between selected countries with respect to, for example, cases and deaths per million population.
Back to top
6. How is data used to decide which tier I am in?
Recommendations about tiers come from the Joint Biosecurity Centre, which is part of the NHS Test and Trace Service and provides 'evidence-based, objective analysis to inform local and national decision-making in response to Covid-19 outbreaks'. Its Director General, Dr Clare Gardiner, has a doctorate in statistics.
It aims to be data-driven: 'The JBC aims to draw upon data, insight and predictive analytics from a range of health and non-health sources, as well as other information feeds and statistical modelling to build a picture of Covid-19 infection rates across the country'.
The JBC also decides on the Covid alert level:
- Level 1: Covid-19 is not known to be present in the UK
- Level 2: Covid-19 is present in UK, but the number of cases and transmission is low
- Level 3: a Covid-19 epidemic is in general circulation
- Level 4: a Covid-19 epidemic is in general circulation; transmission is high or rising exponentially
- Level 5: as level 4 and there is a material risk of healthcare services being overwhelmed
The decision is apparently driven by data. For example the move in early January 2021 from Level 4 to Level 5 occurred when 'the JBC director general, in consultation with NHS senior leadership and CMOs, estimated that forecasted healthcare demand will outmatch forecasted capacity across the UK, regions or devolved administrations within the next 21 days'.
The JBC says it 'will follow a transparent approach to the assessments and analysis it undertakes. We will ensure peer scrutiny and challenge of our analytical methods and seek to crowdsource new approaches to incorporate in our work.' Professor Sylvia Richardson, President of the Royal Statistical Society, is a member of its Data Science Advisory Board.
As part of that transparency around data, JBC issues weekly updates for England on epidemiological data and hospitalisation metrics used by the government to brief MPs on local restriction tiers which feature details of case-rates, hospital admissions, patients in hospital, ventilation rates etc for local authorities, mainly summarising information available on the main PHE Coronavirus dashboard.
It also issues a weekly watchlist giving epidemiological coronavirus (Covid-19) data for each lower-tier local authority in England, which provides a summary watchlist spreadsheet for each lower-tier local authority (LTLA), giving case rates, trends and current tier restrictions, and details of cases, tests and positivity rates at the local authority level.
Back to top

7. What does ‘90% effective’ vaccine mean?
Vaccine efficacy is the relative reduction in the risk of getting the disease provided by the vaccination, under optimal conditions. Say 100 people have caught the disease. Then ‘90% efficacy’ means that if they had all taken the vaccine, then (on average) only 10 would have caught the disease.
Efficacy is estimated by comparing the number of new cases in vaccinated people with unvaccinated people, and the best way of doing this is through a randomised control trial. This is where all volunteers receive an injection, but each individual is randomly allocated to either receive the actual vaccine or a dummy (a placebo).
Due to random assignment, researchers can estimate how good the vaccine is. Researchers look at what proportions of people have a disease in each group and compare them. Different research projects may use different definitions of a case. A case is a person having the disease or virus. They could use different tests or confirm in labs after different periods. These analyses may also look at several outcomes: such as a participant going to hospital.
We can work through an example: the Pfizer & BioNTech phase III study. There were 170 Covid-19 cases. Eight of these were in the vaccine group and 162 were in the placebo group. In this study, there were 'over 43,000' participants. For this calculation, assume there were exactly 43,000 participants. These people are in two even groups.
- Proportion of cases in the vaccinated group: 8 divided by 21,500 is 0.04%.
- Proportion of cases in the unvaccinated group: 162 divided by 21,500 is 0.75%.
The reduction from 0.75% to 0.04% is then 95%. This is our central estimate of vaccine efficacy.
It is important to remember there is uncertainty around estimates. It could be somewhat higher or lower than the central estimate.
Despite the similar name, vaccine effectiveness is a different concept to efficacy. This is about how well a vaccine does outside of optimal conditions, for example when rolled out in huge numbers in the general population.
A randomised control trial might exclude some people from volunteering. Such trials may exclude children, or those with compromised immune systems. Participation affects how well efficacy estimates translate to the general population. Observational studies can suffer from statistical biases. Vaccine programmes may give at-risk groups the vaccine first. There are many factors which affect how effective a vaccine is. Those include individual factors, such as age. Also, the characteristics of the vaccine itself – cost, storage, delivery – matter.
Back to top

8. Are people dying ‘with’ Covid or ‘from’ Covid?
The vast majority of reported deaths with Covid-19 are dying from the disease.
The Office for National Statistics publishes death registration statistics. Medical certificates depend on clinical judgement, and do not need positive test results. For registrations up to 25 December 2020 in England and Wales:
- Deaths involving Covid-19 (as the cause or contributory factor): 77,686
- Deaths due to Covid-19 (as the underlying cause): 70,703
About 9 in 10 registrations involving Covid-19 have the disease as its cause.
Viruses spread in the body by invading cells then reproducing copies of itself. That virus moves on to inhabit nearby cells. In serious cases, SARS-CoV-2 lands in the lungs. That can trigger inflammation as the body tries to fight the virus. It can also injure other organs. Covid-19 patients die due to the disease for many reasons, including respiratory failure.
Public Health England (PDF) analysed deaths where the person had a positive test result. This analysis was up to 3 August 2020, excluding 1,438 deaths not linked to a death registration. 91% of the 40,160 deaths with a positive test result had Covid-19 mentioned on the death certificate. That means Covid-19 was either the cause or contributory factor to the death. That proportion rises to 95% for deaths within 28 days of the first positive specimen date. That includes samples taken after death.
Deaths within 28 days of a positive test result is the lead measure in England. Up to 3 August 2020, about 1,700 people died with a positive test in that time limit – but Covid-19 was not on the certificate.
Between May and November 2020, there were 1,406 registered deaths involving COVID-19 in Northern Ireland (PDF). 9 in 10 (90%) of these registrations had COVID-19 as its underlying cause.
From 16th March 2020 to 14th February 2021, NRS states there were 9,053 registered deaths involving COVID-19 in Scotland (Excel). Of these registrations, 8,071 (or 89%) had COVID-19 as the cause.
Back to top

9. How many people who have died due to Covid-19 would have died soon anyway?
Most people who die from Covid-19 are elderly, and nearly all have underlying health conditions. So a common suggestion is that many of these would have died soon anyway, say over the next few months. But this claim is not supported by the evidence.
When a heat wave or cold spell hits, there can be a temporary increase in the number of deaths, often termed excess deaths. Some of these deaths of frail people might have occurred soon anyway and have been brought forward by the extreme weather, a phenomenon known as mortality displacement or even the rather unfortunate term harvesting. Evidence for mortality displacement is inconsistent, with disagreements over how large these displacements are, and some studies report little evidence of harvesting effects after heat waves.
There were early claims that if there had been substantial mortality displacement in the first wave of the current pandemic in the UK, we would have expected a subsequent deficit of deaths in the summer. But although there was some deficit, it was small compared to the deaths in the spring: specifically, England and Wales saw 59,000 excess deaths (over a five-year average) in the four months March to June, and yet only a deficit of 3,500 non-Covid deaths in the subsequent four months from July to October. However, the continued low level of deaths not involving Covid through the winter 2020/1 may in part be due to deaths being brought forward to the spring of 2020.
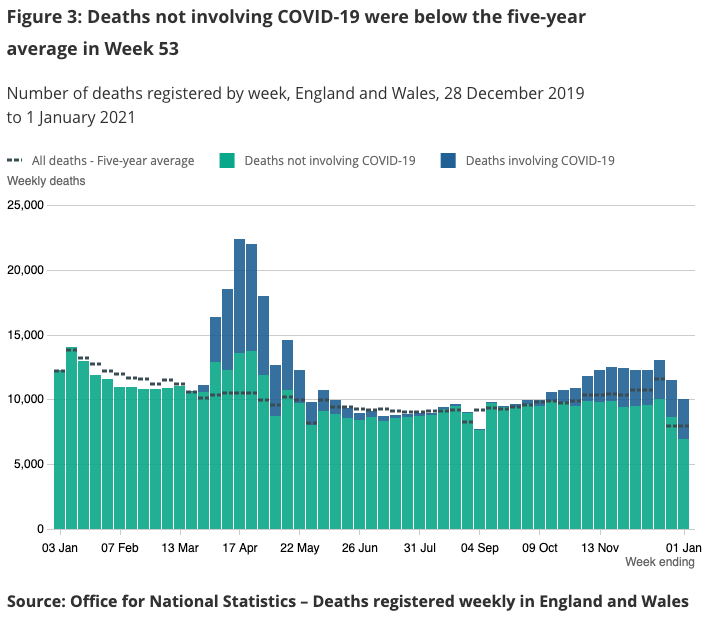
ONS figure from 12 January 2021 showing deficit of non-Covid deaths after first wave
Modelling also suggests a substantial average loss of life expectancy for people who die from Covid. In the first wave, infection led to a mortality rate that was similar to one-year actuarial mortality rates. A basic analysis shows this implies an average loss of 9 years of life for each Covid death, which closely matches an estimate for the US using a much more complex methodology, although it is slightly less than some UK estimates of 14 for men and 12 for women.
Clearly people who die from Covid are not on death’s door.
Back to top

10. How will the risks in future compare with the risks in the peak of the epidemic?
There are a range of possible answers. The future is unknown and that risk differs by country.
A confirmed case means a person with a positive test result for SARS-CoV-2. Confirmed cases are not all cases. There was low capacity for testing in earlier stages of the pandemic. Testing is imperfect. In some countries, confirmed cases are rising. A common term for this rise is a second wave. Distinction between these different ‘waves’ is arbitrary and down to analytical judgement.
Recovering from the virus confers degrees of immunity, reducing the susceptible population. Second waves can be more deadly than the first: such as the 1918 flu pandemic.
Short-term future risks may be higher than in early 2020. Contacts with infected people could increase. Without mitigation, that leads to greater transmission of this new virus. The virus could mutate further.
There are three broad scenarios for each country:
- Endemic: The virus becomes endemic at low levels with seasonal cycles. SARS-CoV-2 circulates like other human coronaviruses and seasonal flu. The number of deaths depends on infections, treatments and vaccinations. This is what happened to the 2009 H1N1 influenza virus.
- Containment: Testing, tracing and isolation programmes help contain the virus. Risks vary over time, with localised spread of the virus. It may take some time for containment to lead to elimination, as it did for the original SARS coronavirus.
- Elimination: The country succeeds in eliminating the virus, but remains at risk of importation.
Back to top