The Challenges
Establishing and maintaining a high standard of production quality is a necessity for all businesses, and a challenge to get right. Fortunately, sampling and statistical monitoring can really help when used well.
The first thing to understand is that it is not possible for a company to test every product it makes as it rolls off a production line or appraise every single service provided. This is where sampling comes in. A certain proportion of products or services are chosen to be tested and the rate at which whatever form of sub-standard quality can be quantified in the sample, is then used to infer the population rate.
Companies will often wonder, “How much do we need to sample?” or “What kind of sampling plan do we need?”. These questions can be the subject of much debate and negotiation as the textbook answers provided by statisticians are not always seen as operationally practical or financially viable.
There are two interested parties to consider when defining the sampling size and sampling plan. First is the company providing the product or service and second is the end customer. The company wants to provide something to the customer that meets their needs and is as low cost as possible. While the customer wants the perfect product every time and value for money. There is some commonality in that both parties want high quality but potentially some differences in the cost. Sampling is not cheap but if not done well it can be significantly more costly to the company with loss of credibility, custom and potentially the ability to operate.
Having started my professional life as a statistician before moving into managerial roles on the shop floor, I have been fortunate to be able to gain multiple perspectives on this problem. From what I have learned and experienced I have found that what is usually needed is a little bit of pragmatism.
Know your product/service and the process that creates it
For Statisticians and Quality Professionals, taking the time to understand what you are looking at and what you are interested in finding or detecting is always the crucial first step. Really get to know what you are appraising, not just by reading reports or customer feedback, but by taking the time to go and look and talk to those who are at the coalface.
This is a stage at which you really need to involve subject matter experts to help get a good grasp of the situation, and your quality control professionals to get a grasp of what levels of defects are acceptable and what are not. Underestimating the importance of this stage and taking shortcuts may result in the outcomes of the sampling providing an inaccurate estimate of the population state. The company does not want to find out the quality of their product/service from their customers and so understanding and dealing with this internally is essential.
Get to grips with the fundamentals of sampling
Sampling is, as previously discussed, a means of gathering information from a subset of a population to then use as an estimate of what is going on with the wider population. To help with this sample size, professionals need to understand what the suspected prevalence of the issue is that you are sampling to find, or the confidence level you require in your estimate. A small number may be enough to find and provide a wide confidence bound around an issue that has a high incidence but if you are wanting to truly understand and accurately quantify the prevalence of the issue then a larger sample would be required, especially if you are looking for, what is essentially, a needle in a haystack.
Equally important, an appreciation of how the defects/issues are distributed throughout the population gives insights as to where to undertake the sampling. If the case is that defects/issues are not distributed evenly, then you would need to carefully plan your approach, again involving experts, to help you identify areas that would be best sampled to make the outcomes representative.
Here is an example to try and bring this home a little: if you wanted to estimate the proportion of people in the UK who use rail to commute to work, you need to consider that some towns have access to rail services and some don’t. Sampling only from towns that have rail stations would likely cause you to overestimate the true proportion in the population, just like sampling only from towns that don’t have stations would underestimate this.
Having come to a good understanding of where your data is generated, and your population of interest, deciding what and how to measure is the next question.
How to measure the quality of the product or service
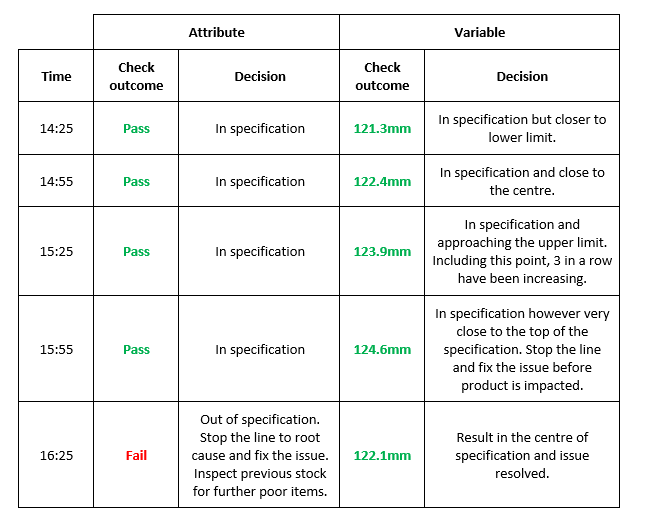
There are two main “categories” which are used to describe the format of the measurements taken on the items that are to be sampled, these measurements can be of the form of an attribute or a variable. Attribute data can generally be considered as categorical or qualitative such as “Acceptable”, “Fail”, “Too Long” while variable data are numerical measurements which give a lot more information and insight.
If you could choose to evaluate a defect using either approach, I would choose using a variable measurement approach every time. To illustrate this contrast, imagine a large manufacturing process, part of which involves a cardboard cutting station with an acceptable length range of 120–125 mm. If during this process the cutter starts to drift, increasing the lengths of the cut-outs, we may be able to correct the drift before it leads to defective parts. This is very easy if we measure the lengths using a variable approach, in contrast to just recording a “Pass” or “Fail” attribute approach.
Specification for an acceptable cut length = 120.0mm – 125.0mm
Using a combination of variable measurements with monitoring is a fantastic means of being able to effectively monitor and influence the quality you are producing if there are the capital, skills and capacity available to accommodate this. Ideally this should be automated with measured results being automatically trended and not relying on teams manually plotting or transcribing data into a secondary system, a process which could provide further issues if values are not transferred accurately.
Measurement Error and Variability
It is imperative that whatever is being monitored, the method used to measure the characteristic (e.g. weighing scales, flow meter, force tester) is accurate and robust. If this is not the case then an organisation may find themselves either over-reacting to signals from the measurement error, or worse, not reacting to clear signals in the data due to these being hidden by measurement variability. Installing a measurement system that is accurate coupled with a process around the use of this as repeatable and reproducible may not be easily achievable depending on what is to be measured and the budget available to the company.
Measurement error is sometimes overlooked when setting up measurement systems, whether it be the Go/No Go gauge or a more conventional measurement system. Measurement error can simply be defined as the amount of variability contributed to the results by the measurement system itself. The two components that represent this variability are repeatability and reproducibility. From performing a review of several web and book sources, the majority of these suggest that a good measurement system does not contribute any more than 10% to the total variability of the results. This additional error present in the measurements introduces the possibility of accepting something that should fail or vice versa.
Performing a Measurement System Analysis (MSA) or Gauge R&R study followed by a process improvement exercise is certainly a wise investment before going straight into routine use. A barrier however is that these are not easy to design or analyse for people without the relevant statistical training or experience. A very simple approach I have taken when asked to support the installation of a new system for performing measurements is go through a script to help expose any obvious risks.
Examples of the common questions and requests are below:
- Could I see a process flow diagram of how the measurement system is to be used that includes the human interaction? – this highlights step by step the procedure to operate the measurement system and exposes any unneeded complexity or controls that are present
- Can I accurately measure to at least 1 decimal point beyond the specification limit? – if your specification is in centimetres, I would expect that the measurement system can accurately measure to, at least, millimetres.
- What could I move around or adjust? – Ideally this should be minimal, having the setup standardised and fixed should minimise the variability present when repeating measurements
- How are the analysts/operators going to be trained? – People need to be trained on how to use the system along with obtaining the knowledge of the importance of each aspect and the potential impact on the measurements
- Can I have a go? – As long as it is safe, request to have a go at setting up the system and making a measurement. Replicating a new person, you may uncover some issues not noticed by more experienced colleagues.
A business does not want to scrap product on the back of an unreliable measurement system or send out product that does not meet the standard and cause reputational damage. It would not surprise me at all if measurement system variability was not even considered when designing and installing systems, a potentially costly mistake to make.
Final thoughts…
Sampling is by no means an easy subject to master, and certainly not the most exciting of statistical concepts, but it is a very easy thing to get terribly wrong for someone who does not know what they are doing. As a statistician or quality professional, spending the time to understand the population of interest that is to be subjected to sampling, what characteristic(s) of the sampled items are of interest and how are these going to be measured, are all vital stages. Working effectively together with process experts increases the probability of being able to provide the solution that has the right balance of being both practical and technically sound. If this is not perfect, remember the role of a statistician is to provide the plan along with the associated risks and it is the business who make the decision to either accept or reject them. It’s not a case of “covering one’s backside” but a statistician’s role is to be consulted and then advise appropriately based on stated constraints and sound science. Many examples in here are from manufacturing but this can be applied to a whole host of other industries as all need to assure and monitor the quality of the products and services they provide and then strive for continuous improvement with both themselves and the customer in mind.
Author
Written by John English – Data Scientist, GlaxoSmithKline and committee member of RSS Quality Improvement Section